Network Topology as a Code
By: Kenneth Acar Garcia
Overview
This solution originated from the concept of dynamically rendering a network topology from a network source-of-truth data source, coupled with an interactive GUI. This interface offers the flexibility to present essential network statistics either for individual devices or specific links.
Pre-Requisite
| No. | Application | Version |
|---|---|---|
| 1. | NetBox | 3.5.6 |
| 2. | Grafana | 9.5.2 |
| 3. | Gitlab | 16.3.0 |
| 4. | Grafana Plugin - Apache ECharts | 5.1.0 |
NetBox
- NetBox as the network source-of-truth will host the necessary data for devices and links which includes the following details but not limited to hostname, interface name and role.
-
NetBox's custom script will function as dataset generator in JSON format. This dataset will then be committed into a local gitlab repository using python via API either manually or triggered by a device record change in NetBox.
The dataset currently contains the following records:
-
Categories
- List of device roles from NetBox
-
Nodes
- Device information containing the following details
- Name - hostname of the device
- Category - role of the device
- URL - optional field that will provide URL redirection feature once you click the device from the network topology GUI
- Iframe - optional field that will provide embedded iframe visual once you hover over the device from the network topology GUI
- Device information containing the following details
-
Links
- Interface information containing the following details
- Source - Source device hostname
- Target - Target device hostname
- URL - optional field that will provide URL redirection feature once you click the link from the network topology GUI
- Iframe - optional field that will provide embedded iframe visual once you hover over the link from the network topology GUI
- Interface information containing the following details
Please refer to this link for the example NetBox custom script that generates this JSON dataset for Apache Echart's consumption.
-
Grafana
-
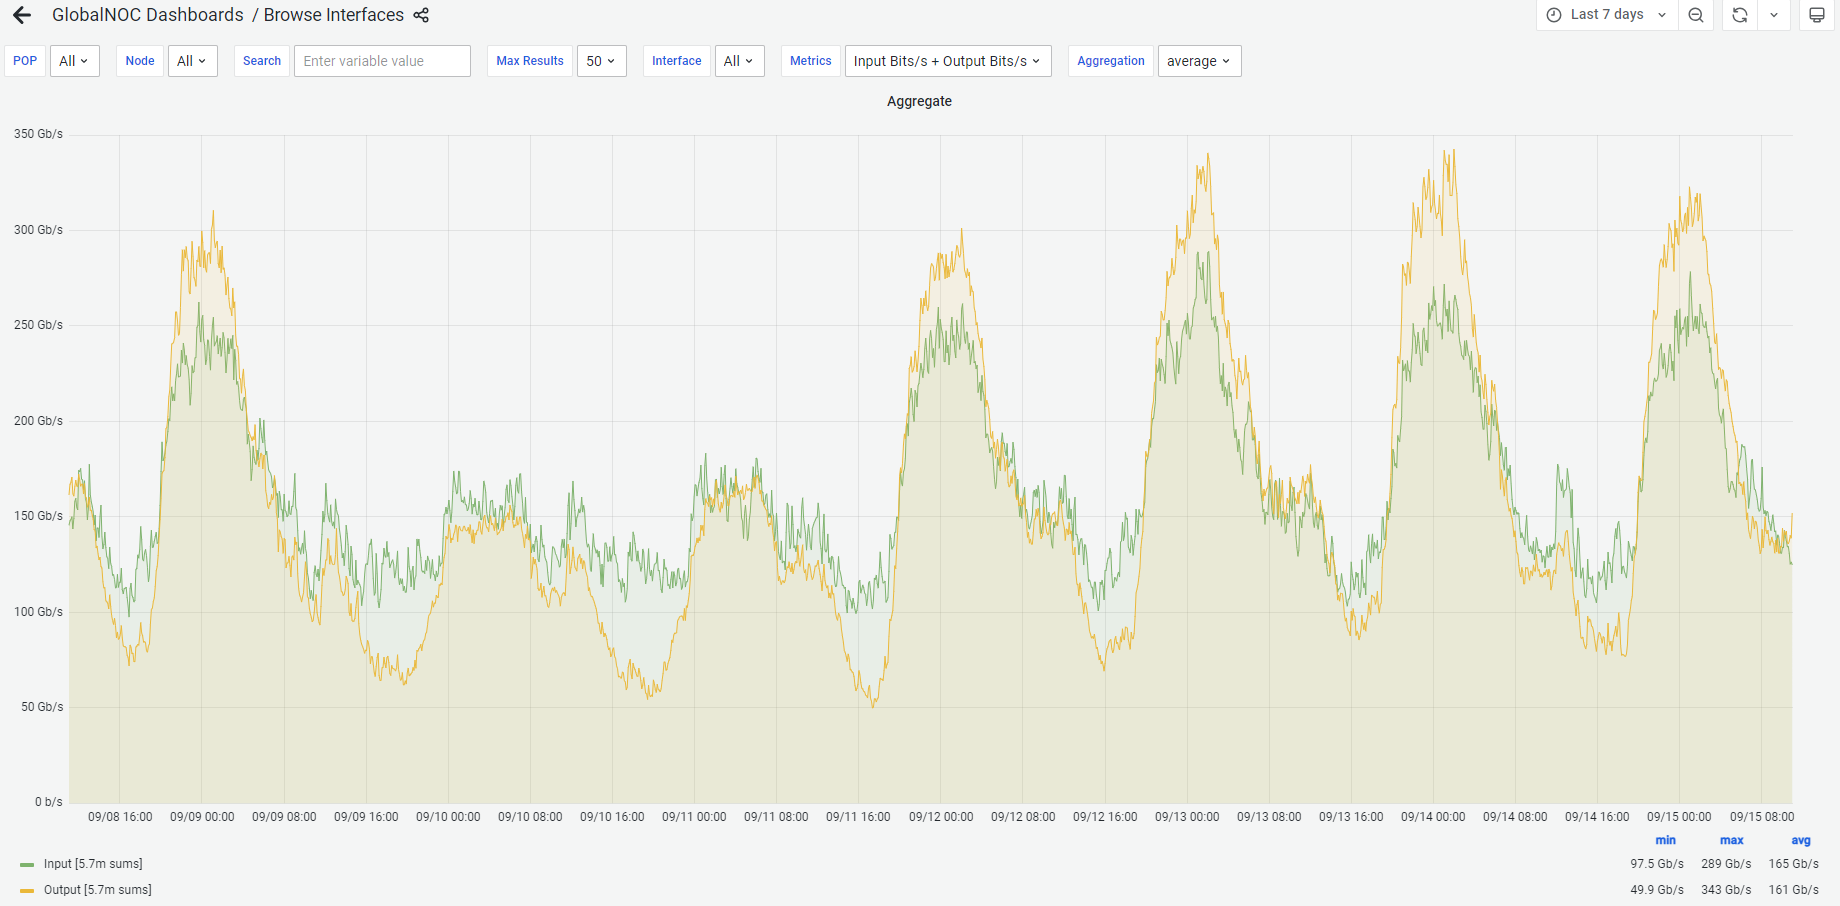
Grafana will be used here as the network telemetry statistics dashboard which contains the following information:
-
Device Statistics
- CPU Usage
- Memory Usage
- Interface Usage
-
Interface Statistics
- Inbound/Outbound Traffic Utilization
-
Gitlab
- Gitlab will be used here as the repository of generated dataset in JSON format by the NetBox Custom Script
-
JSON format dataset will then be fetched by Apache Echarts grafana plugin to dynamically render the network topology with interactive GUI
Please refer to this link for the example JSON format generated dataset.
Grafana Plugin - Apache Echarts
- Apache Echarts is the key component that consolidates the pieces of information from NetBox, Grafana and Gitlab that renders a dynamic network topology from the JSON format data
-
Apache Echarts has a parameter named
Functionthat contains the code in javascript languange for ingesting the JSON format data from Gitlab repository.Please refer to this link for the example javascript function for grafana echarts plugin.
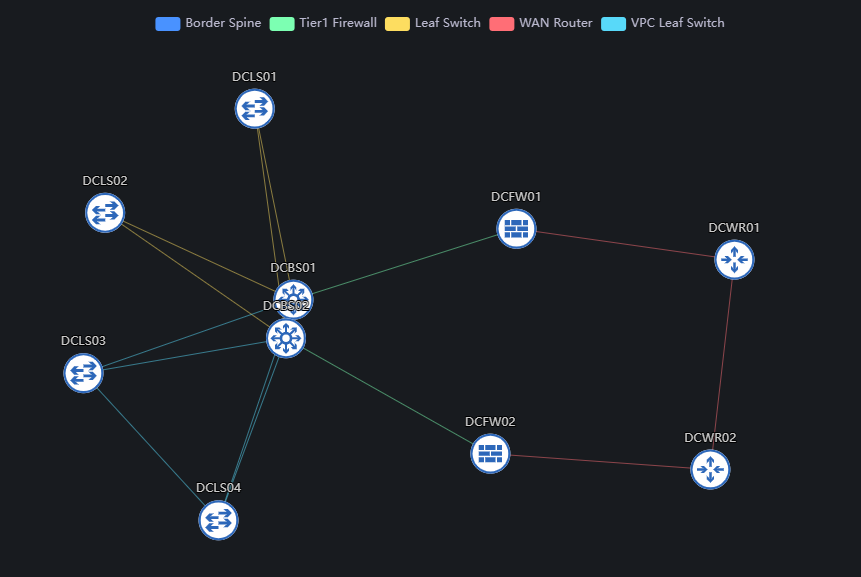
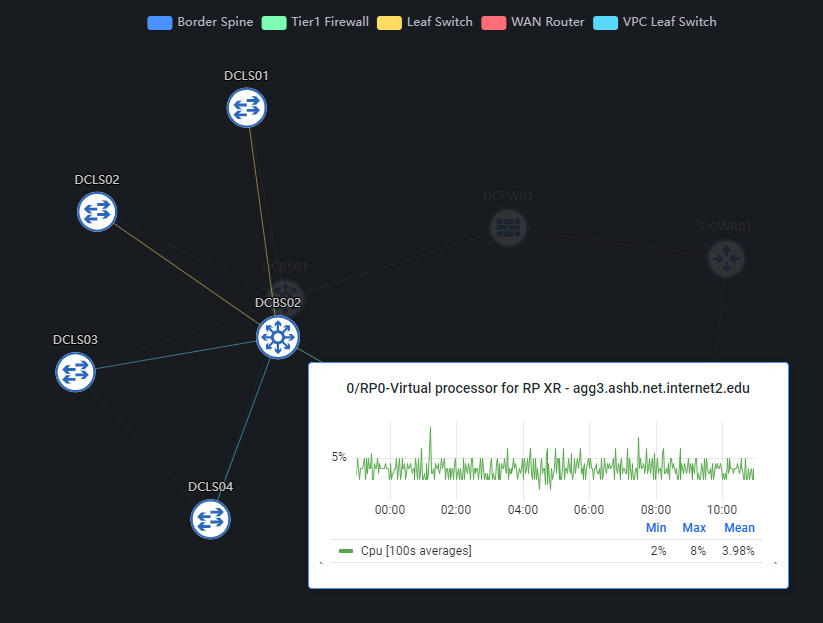
Node OnHover Event
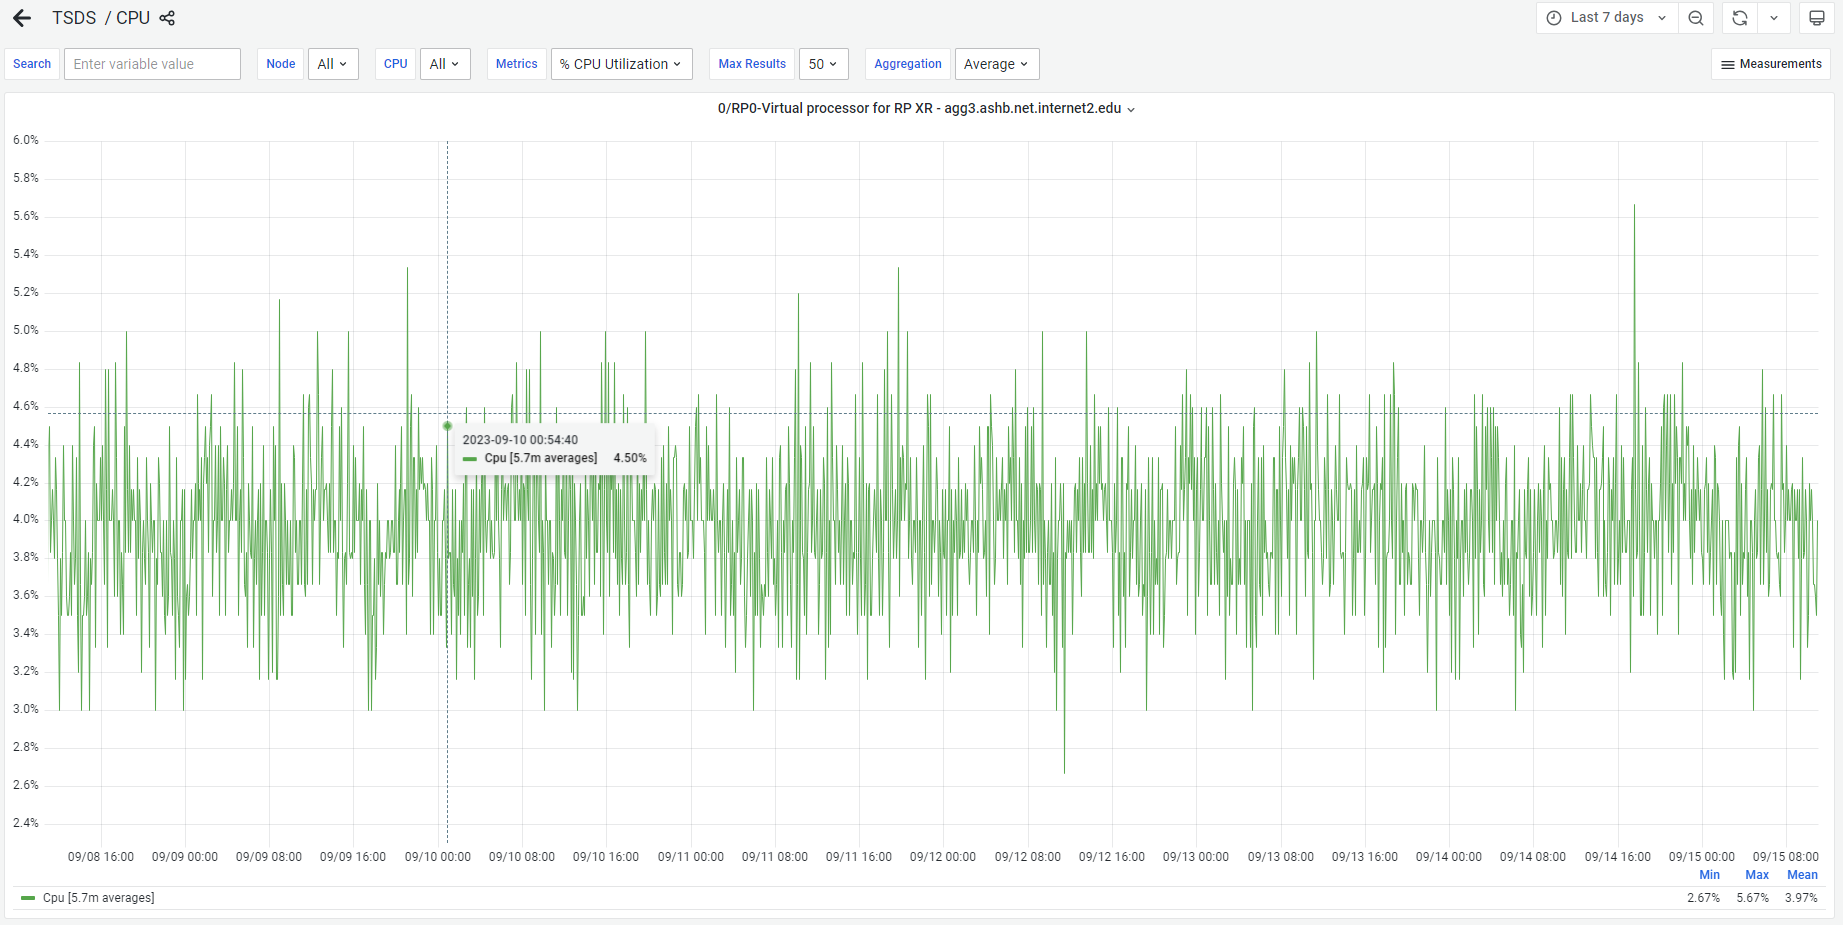
Hovering the mouse pointer to the node will show an embedded iframe display from reference Grafana dashboard panel for resources utilization statistics.
Node OnClick Event
Clicking the mouse pointer on the node will open a new browser page display from reference Grafana dashboard for that device.
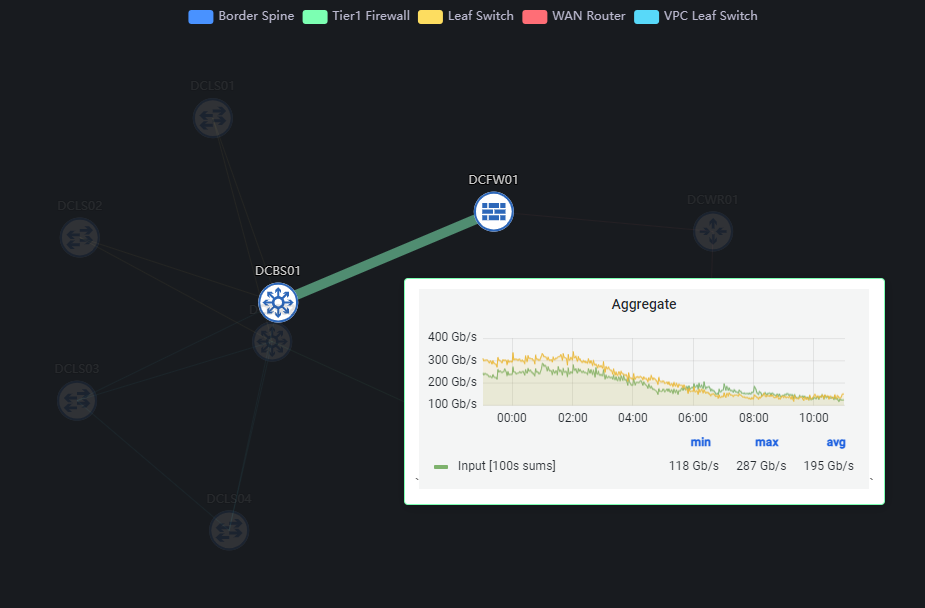
Link OnHover Event
Hovering the mouse pointer to the node will show an embedded iframe display from reference Grafana dashboard panel for interface utilization statistics.
Link OnClick Event
Clicking the mouse pointer on the link will open a new browser page display from reference Grafana dashboard for that interface link utilization statistics.
Credits
- The reference Grafana dashboard screenshots, link and iframe URL were all obtained from publicly available website of Internet2.
- The reference network device icons were all obtained from ecceman/affinity github page.
Caveats
- Chrome/Firefox browsers will block insecure content when viewing Grafana Echarts dashboard that loads content from Gitlab server running unsecured HTTP. Recommended to have a secured HTTP Gitlab server where the SSL certificate is trusted by the workstation being used to view the Grafana dashboard.
- THe JSON dataset file stored in Gitlab should be accessible anonymously from the workstation being used to view the Grafana dashboard. This file is being access from the workstation by the javascript function configured in Grafana Echarts dashboard.
- Due to JSON dataset being loaded from browser JavaScript, cross-site scripting behavior is being blocked by Gitlab's default web server configuration. One option to solve this issue is by updating the Gitlab's nginx web server configuration to allow cross-site scripting.